Scalable Vector Graphics (SVG) format
SVG is an XML-based vector image format, i.e. images are described in a text document with nested tags. SVGs are for two-dimensional graphics and points are defined in an (x, y) Cartesian coordinate system. The SVG format also supports interactivity and animation.
The W3C defines SVG as “a markup language for describing two-dimensional graphics applications and images” (W3C SVG standard).
Most Web browsers can render SVG and SVG have become the most popular vector image format of the Web. The SVG standard was first released in 2001. SVG is a Web standard as defined by the W3C.
The current definition of the SVG format is version 1.1 (Second Edition). A version 2 has been in development.
Key resources
SVG document structure
Tags enclosed in <...> are called elements. Properties of these elements are called attributes.
svg element with viewport and viewBox
grouping elements using ‘g’ element
transform attribute
<path>elementBasic shapes:
<rect>,<circle>,<ellipse>,<line>,<polyline>,<polygon>Text elements
<text>
Note
TODO
Coordinate system
Please note that the origin of any SVG, the (0, 0) point, is defined as the top-left corner with the positive x-axis pointing towards the right, the positive y-axis pointing down.
Path data <path d="..."></path>
The data attribute of a path is a string composed of commands and their parameters.
The SVG format defines 6 types of path commands and a total of 20 commands (i.e. 20 different letters).
# |
Type |
Meaning |
Relative to current position (lower case) |
Absolute position (upper case) |
|---|---|---|---|---|
1 |
MoveTo |
This just moves what is considered the current point. No line will be drawn. This can be thought of as picking up the pen, and setting it down somewhere else. If absolute, this moves the pen the absolute coordinates (x, y). If relative, this moves the pen from its current position \((\Delta x, \Delta y)\) pixels where \(\Delta x\) and \(\Delta y\) can be positive or negative values. |
m |
M |
2 |
LineTo |
This draws a line from the current point to the end point; the latter is specified by the provided parameters. The end point then becomes the new current point. h/H and v/V draw horizontal (h/H) or vertical (v/V) lines. |
l, h, v |
L, H, V |
3 |
Cubic Bézier Curve |
This draws a Cubic Bézier Curve from the current point to the end point. End point as well as control points for start and end point are provided by the parameters. The smooth cubic bézier curve (s, S) only requires 4 parameters. |
c, s |
C, S |
4 |
Quadratic Bézier Curve |
This draws a Quadratic Bézier Curve from the current point to the end point. End point as well as a control point controlling the curvature are provided by the 4 parameters (= 2 points; the current point is known). t/T defines a smooth quadratic bézier curve where the control point is not provided by the 2 parameters (1 point) but derived from the control point of the previous curve command.. |
q, t |
Q, T |
5 |
Elliptical Arc Curve |
This draws an elliptical arc curve and requires 7 parameters. |
a |
A |
6 |
ClosePath |
The command draws a straight line back to the start of the path. Both uppercase or lowercase z here have identical outcomes. |
z |
Z |
Bézier curves
An absolutely amazing interactive online book on Bézier curves is “A Primer on Bézier Curves” which is freely accessible here.
Analysing an example SVG
Let us have a closer look at an example SVG (taken from the excellent Mozilla SVG reference):
<svg viewBox="0 0 100 100" xmlns="http://www.w3.org/2000/svg">
  <path fill="none" stroke="red"
    d="M 10,30
       A 20,20 0,0,1 50,30
       A 20,20 0,0,1 90,30
       Q 90,60 50,90
       Q 10,60 10,30 z" />
</svg>
We can see the command sequence M, A, A, Q, Q, z. The first 5 commands are upper case and, thus, use absolute positioning. The last command, to close the path, is lower case and uses relative positioning. (Both uppercase or lowercase z here have identical outcomes.)
The first command M is a MoveTo command and we would expect two parameters. In this case, these parameters are 10, 30 and, thus, the first action is to move the drawing instrument to the absolute position (x, y)=(10, 30). Note that this SVG has a quadratic size of (100, 100).
The next command defines an elliptical arc curve starting at the current point (10, 30).
Intuitive understanding of SVG path data
The SVG path visualizer (unaffiliated) is a great tool to develop an intuitive understanding of SVG path data. By hovering over a path segment the corresponding part of the code and its explanation is highlighted.
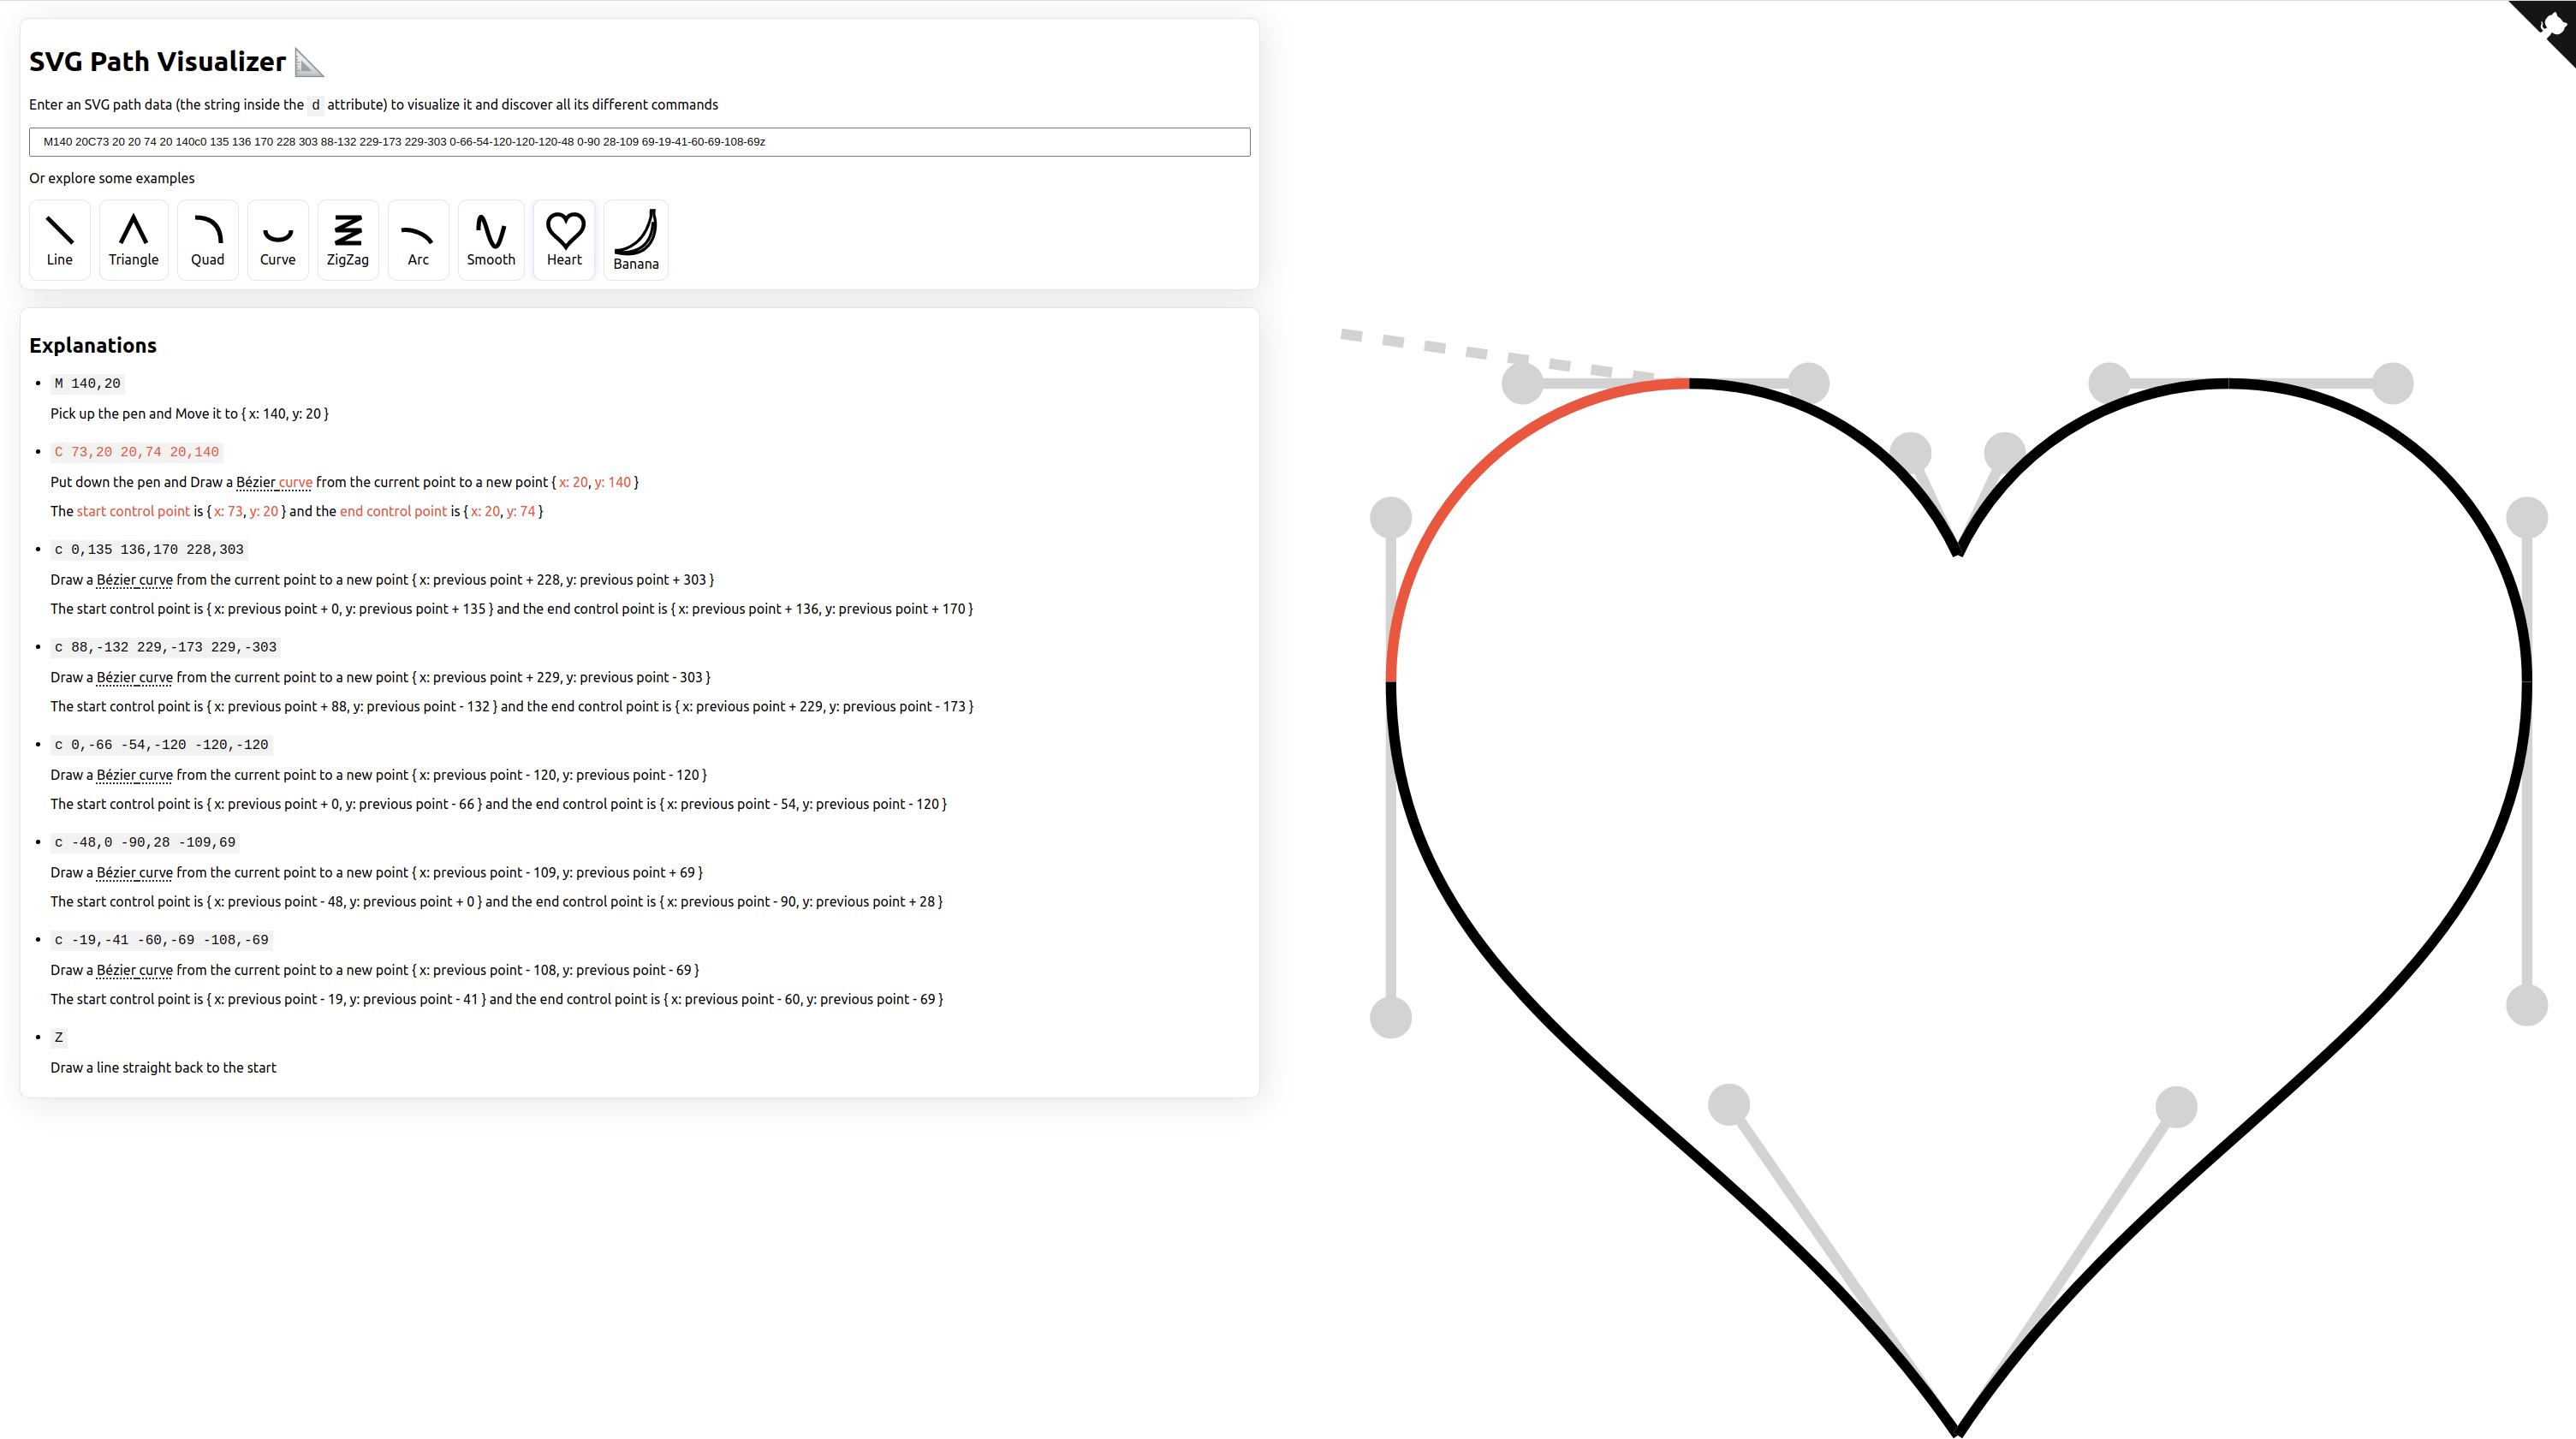
Fig. 3 Screenshot of the SVG path visualizer