Challenges of Vector Graphics
This section aims to summarise why vector graphics are challenging to work with in the context of Deep Learning. The focus will be on generative models and SVG, as the common data format for vector graphics.
To the author, the following aspects appear to be the key challenges:
Data representation
Rasterizing is not a trivial function
Ambiguous SVG source of a PNG
Linear interpolation in case of step changes
Each key challenge shall be discussed below.
Key challenges
1. Data representation
Requirement of numeric tensors (largely solved)
Deep Learning models expect a numeric tensor. However, the common vector graphics format SVG is XML-based and, thus, a text file in the first instance. This is very different from pixel-based raster images which already come as an array of RGB(A) values and, thus, in a tensor format.
So, how do we represent a vector graphic as a numeric tensor?
SVG is a complex format
SVGs can have groups of elements and multiple layers. The SVG format not only defines simple paths but also allows for quadratic and cubic bézier curves as well as other pre-defined SVG primitives (such as rectangles, circles etc.). Shapes can be filled or just an outline. Relevant information can be in CSS files, style tages, attributes of groups etc.
The list of SVG elements (the tags) and the list of SVG attributes that a browser needs to deal with is long.
If we cannot represent all of these (likely!), then we need to simplify and focus on the most common ones. SVGs can contain animations and all sorts of other Web technology (scripts, …) that need to be ignored.
The complexity of the SVG format is a major reason why learning from rasterized images is preferred. Attempting to read all relevant information into a numerical feature vector may easily seem like reinventing the wheel – since browsers have already implemented renderers that convert all the information into a raster image.
Graph structure inherent to SVGs
Since SVG files are XML-based, they also allow for deeply nested tags. This forms a hierarchical structure, a graph of nodes and attributes. In raster images, there is no hierarchy of pixels.
What does this graph structure mean for the data representation and the suitability of specific models?
A loss function makes more sense in raster space than in SVG space
Defining a loss function in SVG space does not seem to be the right approach. Instead, we want to achieve a specific visual result.
2. Rasterizing is not a trivial function
Translating an SVG to its visual representation is not trivial and not as straightforward as it is for a raster image with (R,G,B) pixel values. SVGs have layers. Elements can be partially occluded. Mathematical descriptions of shapes have to be converted into the RGB pixel values.
It cannot be taken for granted that a Deep Neural Network alone can internalise the “knowledge” of how to convert an SVG into a raster image and how changing the SVG would impact the resulting raster image. It may be required to use both vector graphics and corresponding raster images as input (dual-modality) and/or to also rely on a differentiable rasterizer.
3. Ambiguous SVG source of a PNG
Converting an SVG to a PNG (“rasterizing” or “tracing”) is not a bijective function. There are many ways to design an SVG that results in the same rastered PNG. Given a PNG, one can only derive possible SVG compositions. But one can not know how the original SVG was designed.
Consider the following figure showing two icons of a magnifying glass. In “raster space”, the two magnifying glasses look near-identical. In “SVG space” however, they have been constructed very differently. The icon on the left has been designed using 7 points and corresponding bézier handles. The icon on the left uses 18 points and corresponding bézier handles.
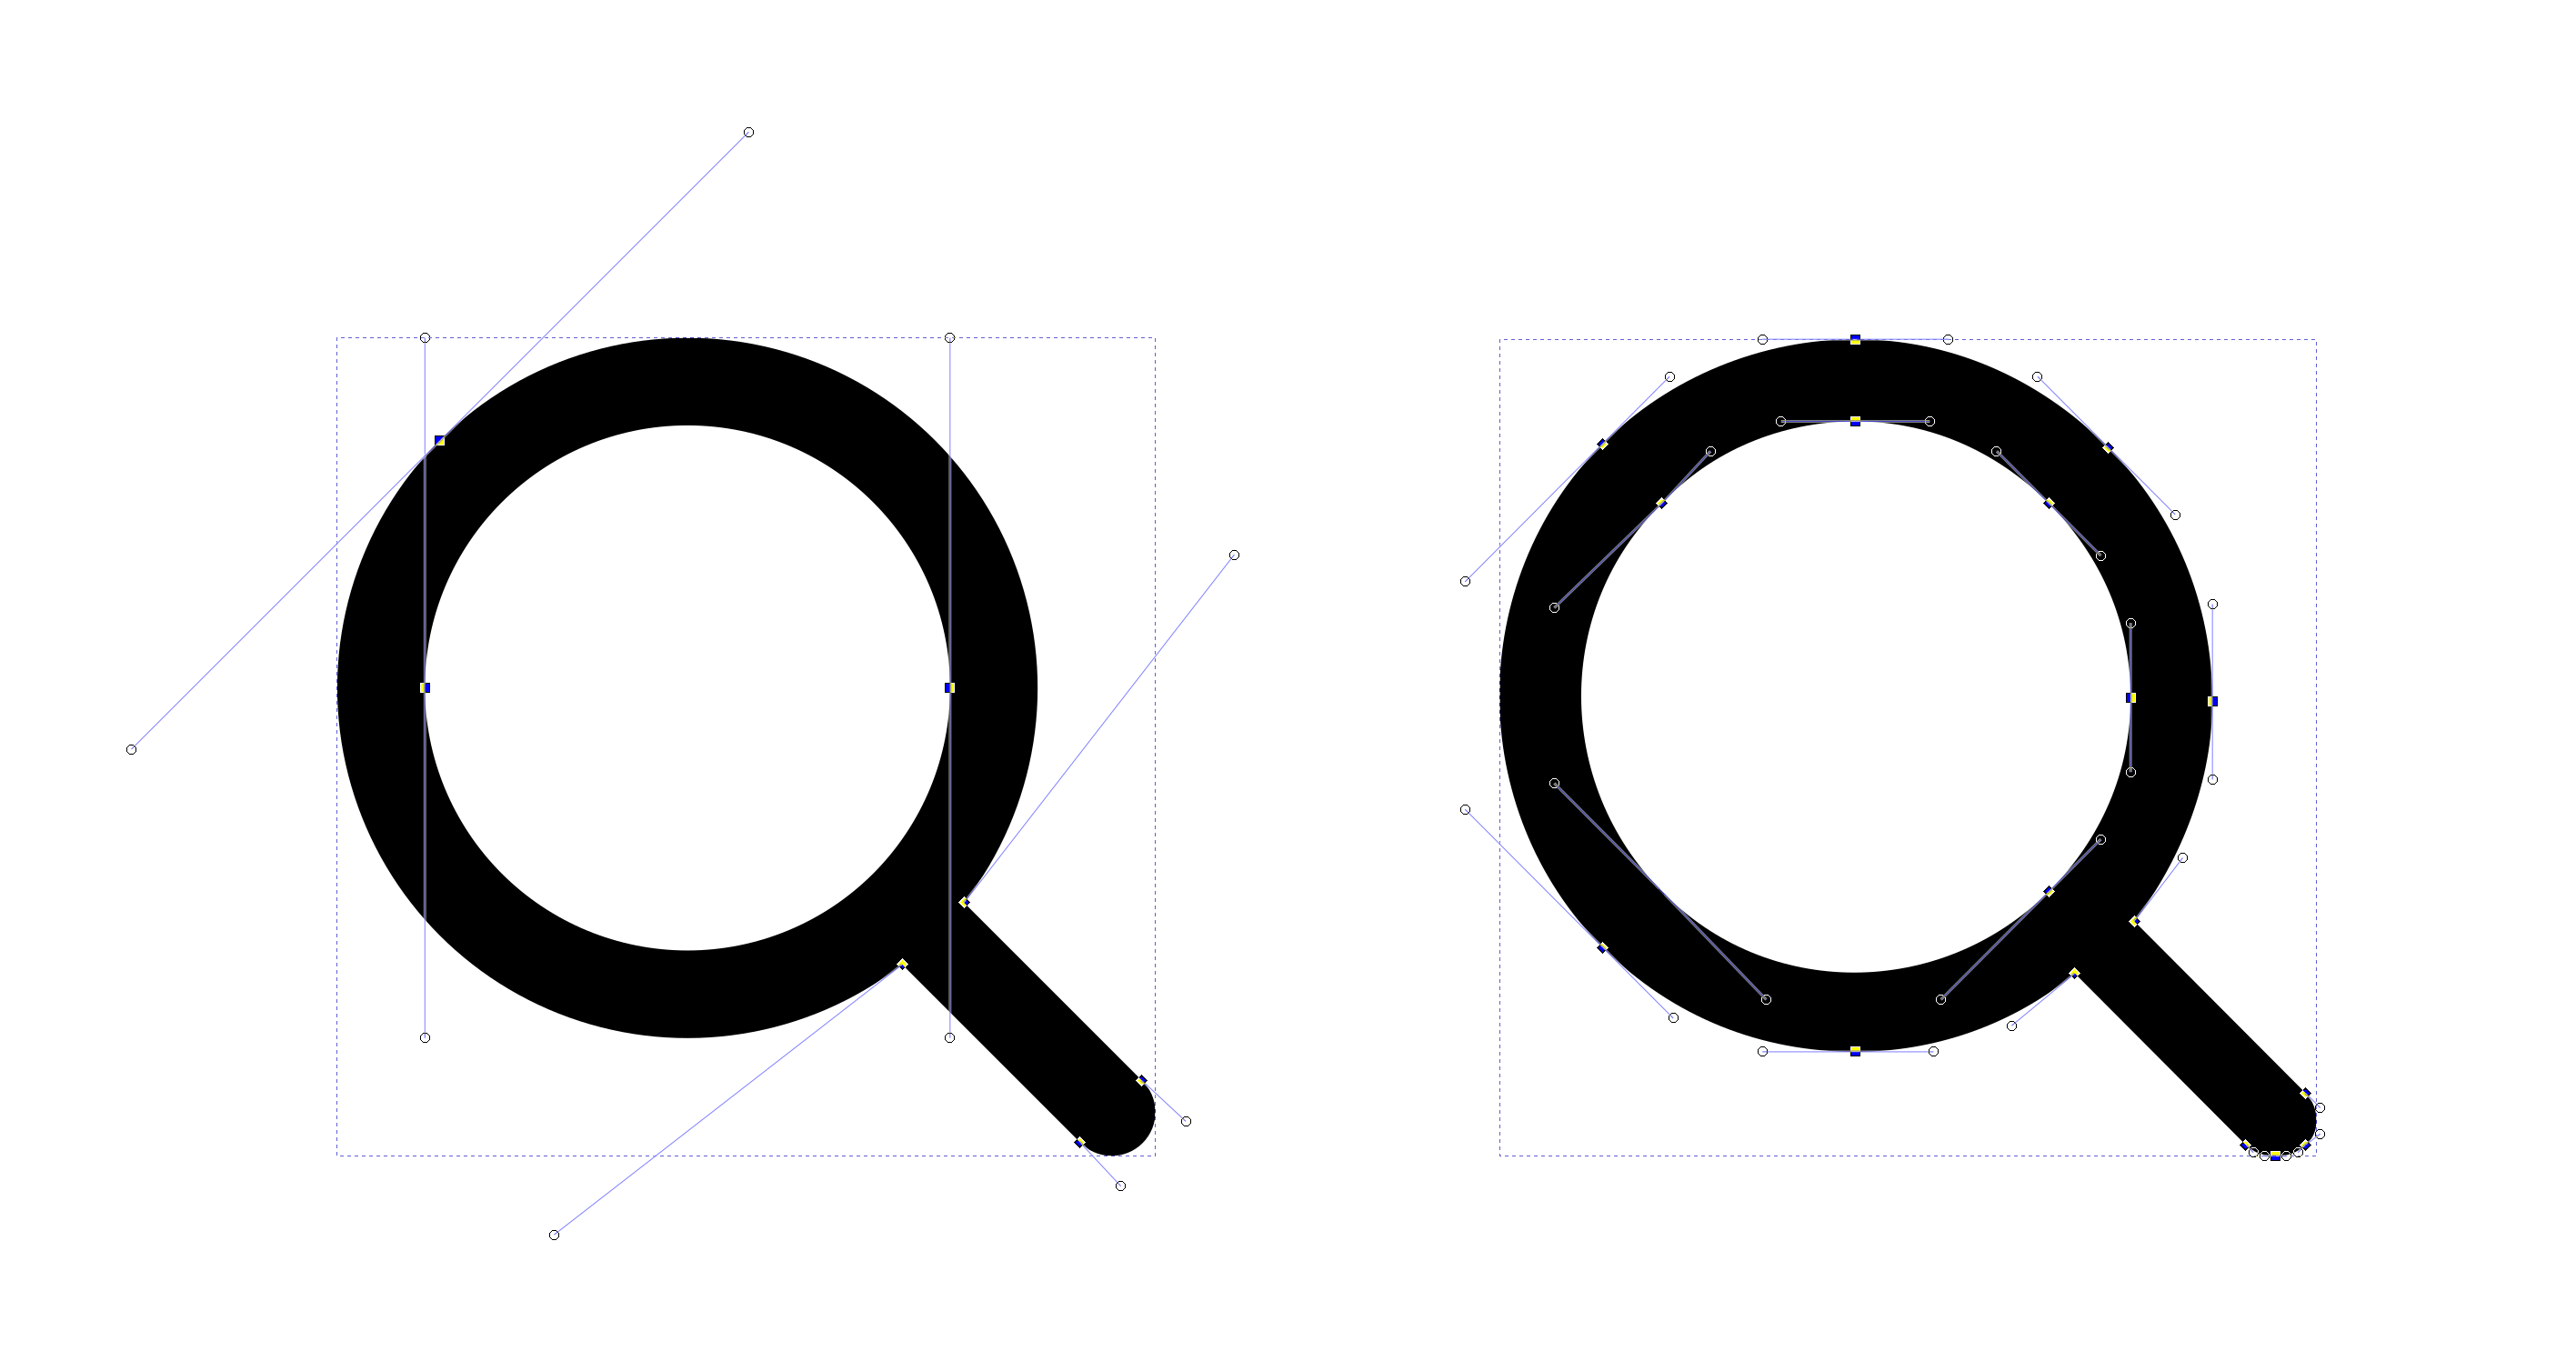
Fig. 17 Near-identical SVG images can be built very differently. Click to enlarge the image and view the differences.
That makes learning just from raster images difficult if one wanted to output SVG in the end.
4. Linear interpolation in case of step changes
How could linear interpolation in latent space work when the images look similar but the SVG composition differs?
By design, a raster image allows for linear interpolation between images. That is, one can always find a way to gradually alter pixel values to gradually morph one image into another.
This may or may not be different for vector graphics. Let’s take two visual representations of the same concept, an eye. Both images below look similar. In raster space, one could easily imagine how to morph one eye into the other.
But in the vector image space, one image consists of two separate paths, and the other consists of just one.
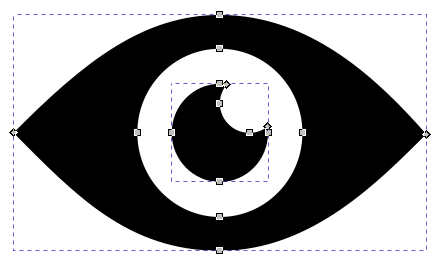
Fig. 18 Icon of an eye opened in Inkscape; the eye consists of two separate paths
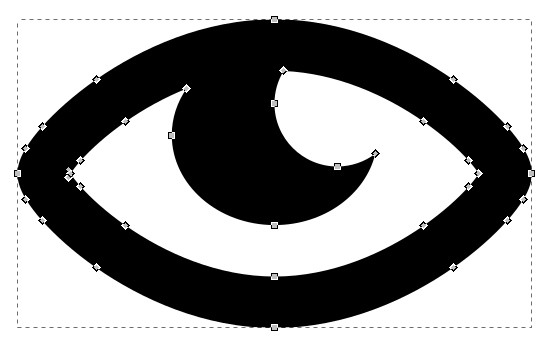
Fig. 19 Icon of an eye opened in Inkscape; the eye consists of just one path
Now, how would linear interpolations between these SVG representations work? How would a linear interpolation look if one the icons even had the white part of the eye explicity modelled as a shape? Is this still possible in an end-to-end model or is that the point where we need to design two parts: a generative model in raster space and one deep learning-based vectorizer?
We know from the DeepSVG paper by Carlier (2020) that it is technically possible to generate linear interpolations between two vector graphics with a different number of shapes. But are these interpolations as useful as interpolations in raster space?

Fig. 20 Linear interpolation between two vector graphics as made possible by DeepSVG; image taken from the DeepSVG paper
Further challenges
SVGs have an x,y coordinate system of a certain size; in addition only a certain part of it may be defined to be shown to the user (viewport)